
Every link in RedirHub has its own traffic report: a trend of clicks (or scans, for QR codes) over time, the latest visits and detailed reports below. Use it to see whether a campaign, a printed QR code or a migrated URL is getting traffic. How far back you can look depends on your plan: 90 days on Core, 6 months on Pro, and set by contract on Enterprise.
Step 1: Open the link#
In Links, click a link to open its details and scroll to Traffic trend.
Step 2: Pick a time range#
Choose 24H, 7D, 14D, 30D or 90D. On Pro you can also choose 6M. The chart shows the clicks or scans for each day of the range.
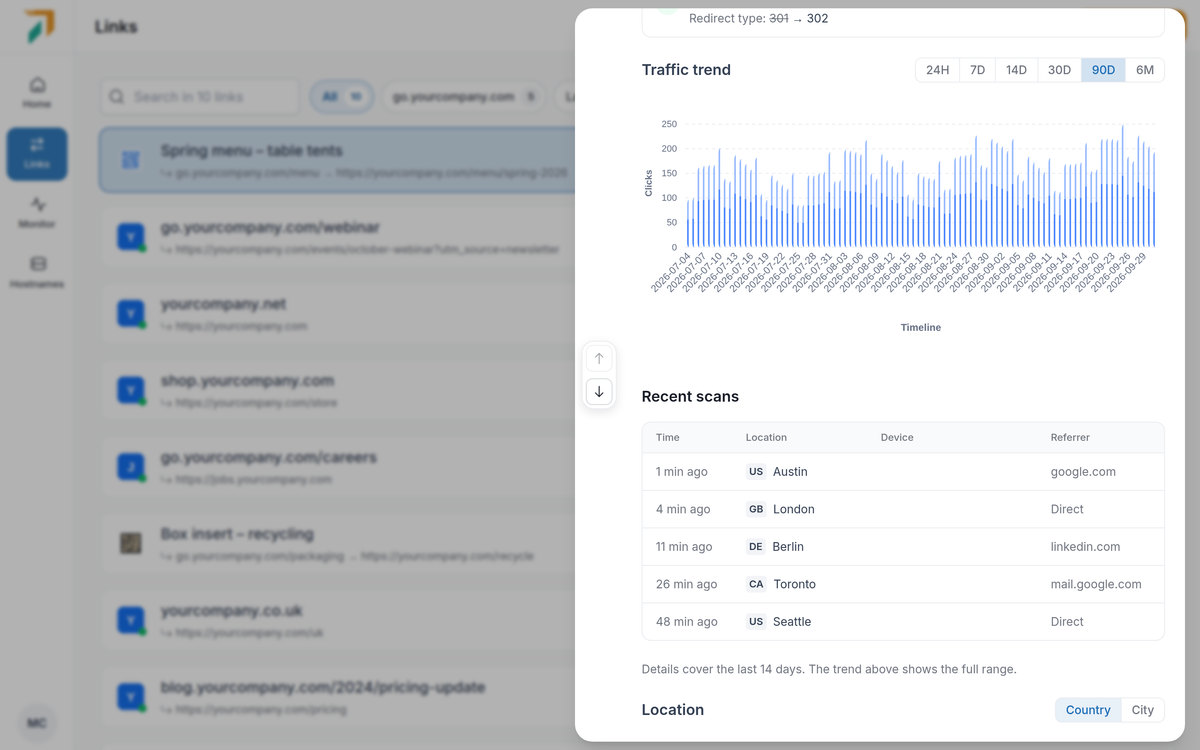
The trend covers the full range; details cover the last 14 days.
Step 3: See recent visits#
Below the chart, Recent scans (or recent visits for other links) lists the latest visits with time, location, device and referrer. It shows the most recent visits by count, not for a fixed time window.
Step 4: Read the detailed reports#
Further down, detailed reports break traffic down by location (switch between Country and City), technology, domain and referrer. They follow the range you chose, up to the last 14 days; beyond that, only the trend covers the full range.
Good to know#
| Plan | Trend history | Longest range |
|---|---|---|
| Core | 90 days | 90D |
| Pro | 6 months | 6M |
| Enterprise | Set by contract | Set by contract |
- Detailed reports cover the last 14 days. Enterprise can keep them longer, as set by contract.
- QR codes count scans; other links count clicks.
Frequently asked questions
Core keeps 90 days of click and scan history, Pro keeps 6 months, and Enterprise is set by contract.
Detailed reports cover the last 14 days. The trend chart above them covers the full range you chose.
No. The 6M range is part of Pro. Core shows up to 90 days.